Carbon: Revealing the Graphitization Behavior of High Rigid and Thermal Conductive Graphite Carbon Fibers
1、Background introduction
The demand for lightweight and efficient thermal management materials is becoming increasingly urgent in fields such as new energy batteries, 5G communication, and aerospace thermal control. Traditional metal materials have excellent thermal conductivity but high density, while conventional polyacrylonitrile (PAN) - based carbon fibers are limited by structural defects and have insufficient thermal conductivity. For example, the commercial grade Cytec T-50 has a thermal conductivity of only about 70 W m ⁻¹ K ⁻¹, which is difficult to meet the heat dissipation needs of high-end equipment.
High temperature graphitization is a key means to enhance the performance of carbon fibers. Research has shown that PAN based carbon fibers undergo significant crystal structure rearrangement above 2000 degrees Celsius, and an ordered graphite structure appears at 2100 degrees Celsius. The carbon content increases to over 99% with temperature. However, there is a trade-off between mechanical properties and thermal conductivity during the graphitization process: high in-plane energy conduction leads to near surface crystal coalescence, forming too many grain boundaries and affecting the overall performance balance.
2、Research findings
Recently, Professor Han Gi Chae from the Department of Materials Science and Engineering at the Ulsan National Institute of Science and Technology (UNIST) has made new progress in the field of high rigidity and thermal conductivity carbon fiber materials. We explored the potential of high rigidity and thermally conductive carbon fibers in thermal management applications. Polyacrylonitrile (PAN) based carbon fibers were graphitized at 2300 degrees Celsius through a continuous process, with a tensile modulus of 427 GPa. Microstructure analysis reveals the trade-off reaction between mechanical properties during the graphitization process. This balancing reaction of mechanical properties occurs due to the rearrangement of crystal structure above 2000 degrees Celsius. The inherent properties of graphite, especially the high in-plane energy conduction during graphitization, lead to rearrangement and coalescence of the crystal structure in the near surface region. Therefore, there are clearly too many grain boundaries in the surface area, leading to a trade-off reaction. The results indicate that fibers graphitized at 2300 degrees Celsius exhibit highly developed carbon structures in the surface area region with a mixed stacking sequence. The measured thermal conductivity is as high as 292 W m-1 K-1, far higher than commercial PAN based carbon fibers, overcoming the limitations of polymer carbon materials. This enhanced conductivity originates from the highly developed carbon structure in the surface area, which is an effective pathway for energy conduction. The resulting fibers exhibit enormous potential as lightweight thermal management materials for applications. The research findings, titled "Unveiling the Graphitization Behaviors of Highly Stiff and Thermally Conductive Graphitic Carbon Fibers," were published in Carbon.
3、Quick overview of graphics and text
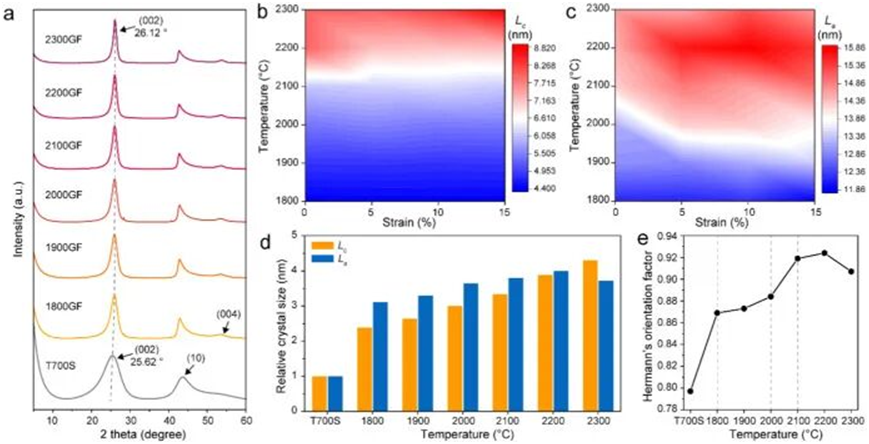
Figure 1. Characterization of the crystal structure of graphitized fibers using wide-angle X-ray diffraction (WAXD) (a) Integral scan of graphitized fibers with temperature variation; (b) Two dimensional contour map of carbon crystal thickness and (c) lateral size of graphitized fibers as a function of temperature and strain (color transitions from blue to red as the value increases); (d) Relative crystal size (normalized to 1 based on the value of T700S); (e) Hermann orientation factor of graphitized fibers (dashed line represents specific temperature at which drastic changes occur).
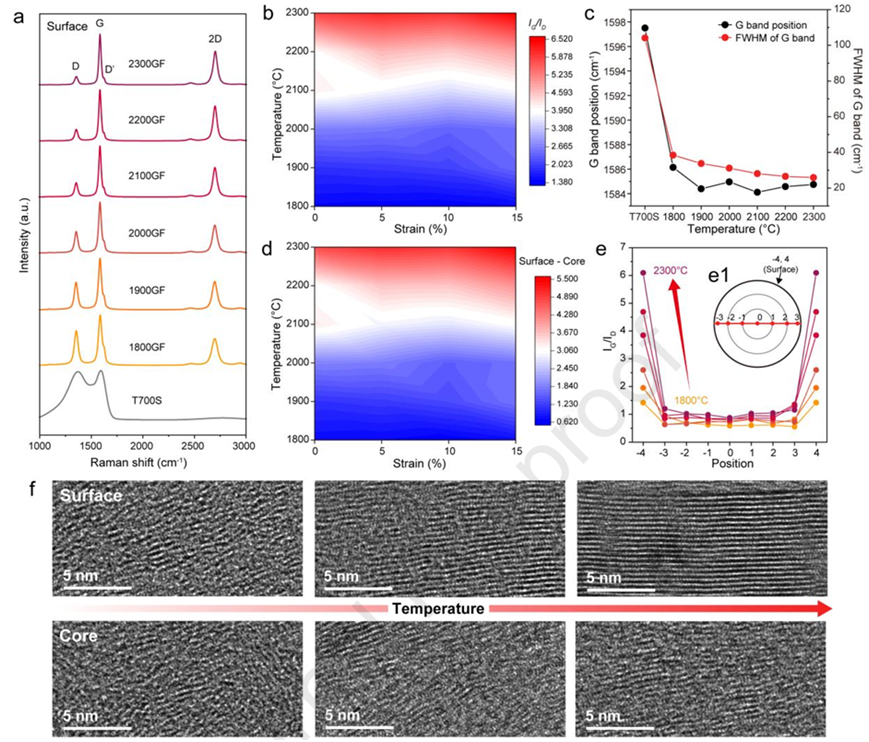
Figure 2. Microstructure of graphitized fibers under different graphitization temperatures and radial conditions (a) Raman spectra of surface regions; (b) Two dimensional contour map of IG/ID ratio variation with temperature and strain during graphitization process; (c) The relationship between G-band position and full width at half maximum (FWHM) and graphitization temperature; (d) Two dimensional contour map of radial non-uniformity (the difference between surface region IG/ID ratio and core region IG/ID ratio) with temperature and strain during graphitization process; (e) The IG/ID ratio of graphitized fibers at different radial cross-sections and temperatures; (f) High resolution transmission electron microscopy (HRTEM) images of graphitized fibers under different radial and temperature conditions show that as the graphitization temperature increases, more developed carbon structures are observed in the surface area of the fibers.
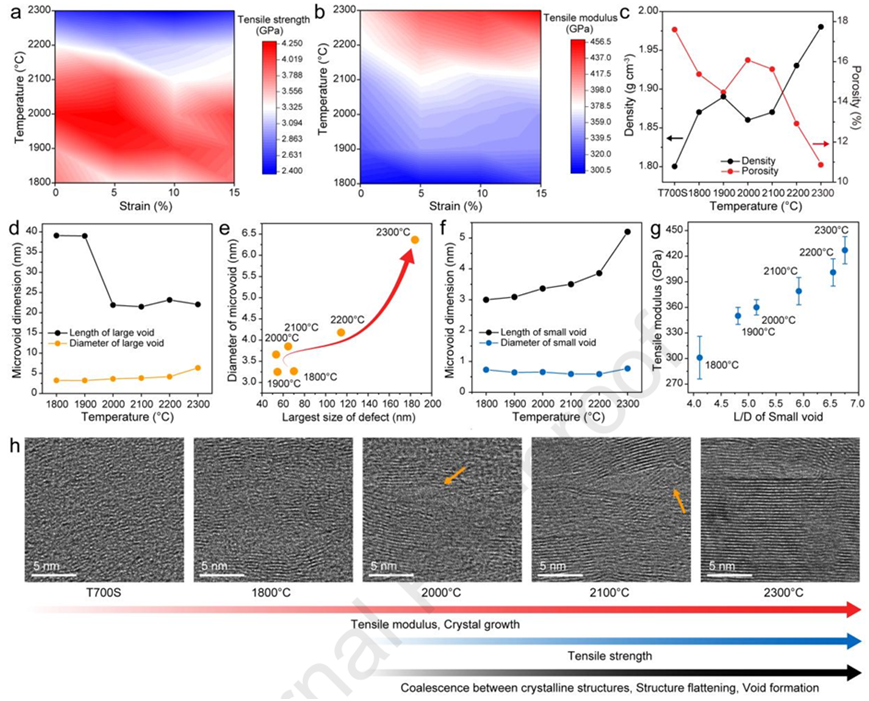
Figure 3. Mechanical properties and structural characterization of graphitized fibers (a) two-dimensional contour plots of tensile strength and (b) tensile modulus as a function of temperature and strain; (c) The relationship between the density and porosity of graphitized fibers and temperature variation; (d) Large sized micropores between microfibrils; (e) The relationship between the diameter of large-sized micropores and the maximum defect size (the maximum defect size is calculated using the Griffith equation [21]); (f) Small sized micropores between carbon crystals; (g) The relationship between tensile modulus and the aspect ratio (L/D) of small-sized micropores; (h) High resolution transmission electron microscopy (HRTEM) images of graphitized fibers at different temperatures. The size and tensile modulus of carbon crystals increase with the increase of graphitization temperature; When the temperature exceeds 2000 degrees Celsius, intense fusion, flattening, and pore formation between adjacent crystal structures can be observed, resulting in a significant decrease in the tensile strength of graphitized fibers.
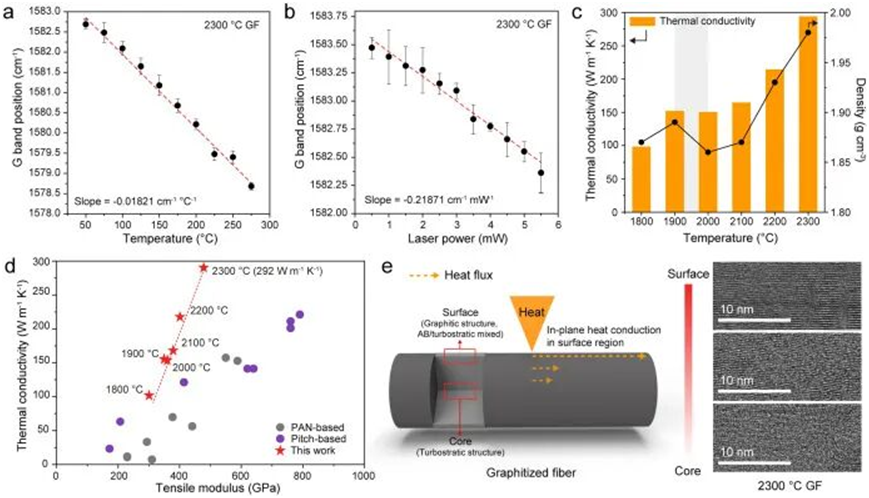
Figure 4. Characterization of thermal conductivity of graphitized fibers (a) The G-band position of graphitized fibers at 2300 degrees Celsius varies with the heating table temperature, (b) The G-band position of graphitized fibers at 2300 degrees Celsius varies with the laser power of the Raman spectrometer; (c) The relationship between the thermal conductivity and density of graphitized fibers calculated with temperature variation; (d) This study compares the thermal conductivity of graphitized carbon fibers with the tensile modulus of commercial carbon fibers; (e) Schematic diagram of the heat dissipation mechanism of graphitized fibers, with high-resolution transmission electron microscopy (HRTEM) image on the right showing radial based structural heterogeneity.

